At the end of every quarter, I share a snapshot of my current finances. This includes what I’m invested in, their values and the change over time. The goal in sharing this information is to show it’s possible to make money investing in super-simple ways without the need to watch the latest news.
If you want to look back at past investment reports, you can view them all in one handy place or check out these links to the past few:
- Minafi 2017 Q3 Fall Investment Report – $1,088,008.50
- Minafi 2017 Q4 Winter Investment Report – $1,221,774.00 (+12.2%)
- Minafi 2018 Q1 Spring Investment Report – $1,202,654.00 (-1.59%)
- Minafi 2018 Q2 Summer Investment Report – $1,236,856.00 ($2,068,156.00) (+2.84% investments or +71.9% net worth)
- Now – $1,226,089.00 ($2,292,717.00) (-0.91% investments or +9.79% net worth)

This is my 5th post in the one in the series, which means I’ve officially been doing this investment report series for a year! My hope is that people realize how easy it is to invest and take control of their own investments. Whether that’s reading a book on the topic, taking my free investing course, or looking at what others are doing and learning from that.
When I learned to invest it was a combination of all of these, and I always wished more people shared the nitty-gritty of their own decision making. I hope this helps to highlight what I’m investing in, why, and get feedback from people more experienced than myself about ways to improve.
Before getting started – just a heads up – this post is kind of long. This is the process I go through every quarter to look back at my investments and spending and decide what changes to make.
In these investment reports, I typically dive into my numbers with full transparency. As with last quarter, this one will be slightly different. I’ll still share my numbers, but there’s going to be a little hand waving for parts of it. This isn’t because I want to hide anything, but because I’m now working at a publicly traded company, and they’ve driven the fear into us about talking about some things. For that reason, I’ll be mostly focusing on my big picture:
- Account value
- Net worth
- Asset Allocation
- Proposed changed I’m making
- Spending
- Category breakdown
- Savings Rate
- Progress towards FI
This post will be long, but it’s a good dive into an entire quarter of tracking and work.
Account Value Over Time
After a rough Q2 and mostly flat Q3, stocks rebounded slightly but ended the quarter mostly flat. I’ve managed to invest a little bit, but overall my assets have ended about level. During this quarter, my investments fell by 0.91% from $1,236,856.00 to $1,226,089.00. This is a small enough drop that I’d consider things flat for the quarter.
One of the reasons for this is because we ended up withdrawing $30k from our investments this quarter. This $30k was partially to pay for our new car (which ended up being a lot cheaper than I expected) but also because we’re fully maxing out 2 401ks and putting in $25,000 over 6 months in an ESPP plan.
In other words, over $7.5k each month is going into deferred savings, which left us strapped for a cash cushion. We’d rather save in these much more favorable ways and down a little than miss the opportunity! Here’s a look at investments and net worth over the last few years that I’ve meticulously tracked it.
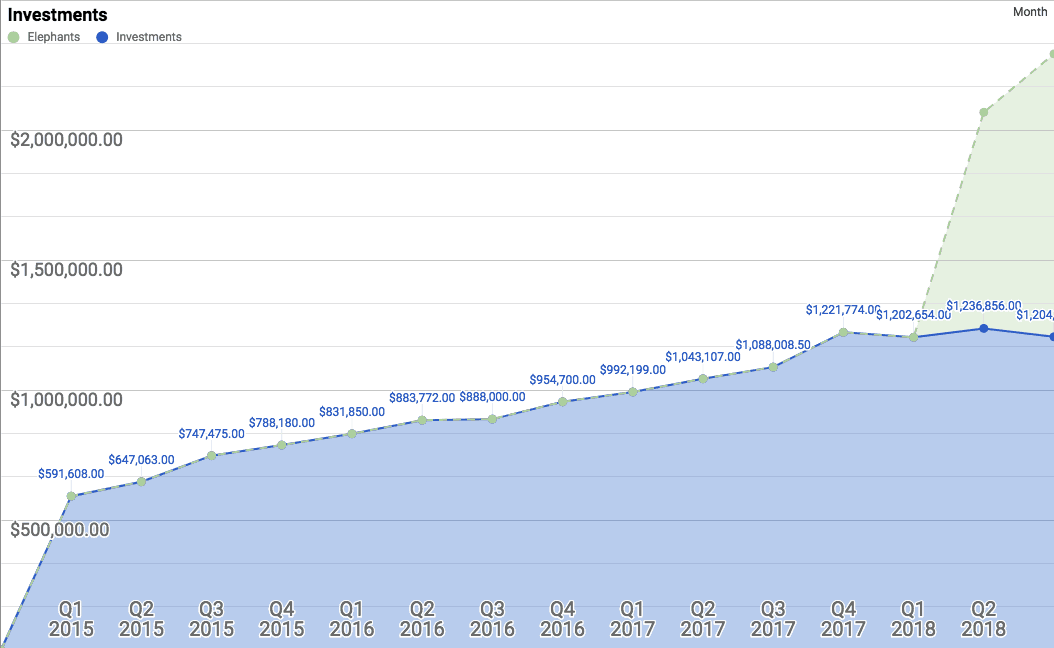
Slow and steady rise upwards! The blue line is my investments, while the elephants are my total net elephants (the key helps).
At $2,292,717.00 they’re up +9.79% for the quarter, which is just insane. For more information on this, you can check out last quarters investment report.
Elephants are unpredictable, and you never know what they’re going to do next. Unlike the relatively calm blue line, these elephants are feisty. Here’s a shot from September 17th alone.
My heart can only take so much! We’ll see where the elephants go next quarter. At one point this quarter the total value was up over $2.5 million, which is equal parts disbelief and utter amazement. It’s hard to make plans with elephants – you never know what they’re going to do. Flexibility is key.
Side note: I’m writing this two weeks into October and the value has already dropped to under 1.9m. Talk about large swings in just one year!
Investments
My flavor of investing follows the minimal investor style that helps me sleep at night. It focuses on a few core principles:
- Invest 95% in diversified index funds (whatever I want in the last 5%).
- Lower fees, load and any management costs to the minimum.
- Don’t use two funds when one fund will do.
- Rebalance quarterly-preferably by shifting where future investments go rather than by selling.
You can see from the above chart over time that this has done very well! It’s hard to say exactly how well though. I have had some windfalls during that time, and I’ve also been investing during an epic bull market.
In 2015, for example, my investments actually lost $50,000+, but my account value was up due to added savings. With that caveat aside, here’s a look at what I currently invest in:
| Account | Holding | Value Q1 | Value Q2 | Value Q3 | Percent |
|---|---|---|---|---|---|
| 401k | Spartan Bond Index | $87,963.13 | $92,354.81 | $94,582.63 | 4.68% |
| Roth IRA | Vanguard REIT | $43,258.66 | $48,232.05 | $46,422.29 | 2.30% |
| Roth IRA | Vanguard Total Bond Market | $36,274.11 | $67,341.04 | $66,649.61 | 3.30% |
| Brokerage | Vanguard Small-Cap Index | $73,019.98 | $63,298.67 | $60,170.83 | 2.98% |
| Brokerage | Vanguard Total Intl Stock Index | $259,438.49 | $249,442.63 | $230,648.57 | 21.50% |
| Brokerage | Vanguard Total Stock Market | $488,952.82 | $531,347.05 | $503,941.76 | 24.92 |
| Brokerage | Vanguard Intermediate-Term Tax-Exempt Fund Investor Shares | $14,522.29 | $100,474.63 | $64,753.67 | 3.2% |
| Brokerage | Wealthfront | $10,037.00 | $9,806.00 | $9,997.00 | 0.81% |
| Brokerage | Betterment | $9,984.28 | $9,783.00 | $10,132.00 | 0.83% |
| Other | Ethereum | $42,184.23 | $37,317.90 | $19,283.45 | 1.57% |
| Other | Bitcoin | $24,950.82 | $19,418.13 | $20,274.00 | 1.65% |
| Cash | Cash | $36,195.00 | $39,415.92 | $36,465.93 | 2.50% |
| Total | $1,206,509.21 | $1,290,086 | $1,226,089.00 | 100% |
You’ll notice this doesn’t add up to my total net worth. This is purely the investments side. This list is needlessly complex. Some of these funds I have because I bought them a long time ago and now it would be painful to sell them. I have (seemingly) duplicates of others due to multiple accounts. The list of accounts seems to be growing faster than I can do write-ups! I listed them all in my money map, but they include:
- My brokerage
- My Roth IRA
- My 401k
- My checking
- Mrs. Minafi’s Roth IRA
- Mrs. Minafi’s 401k
- Mrs. Minafi’s checking
- Our checking
- Our brokerage
One of the most common investment questions I get is about asset allocation, and how to do that over multiple accounts. The real-world answer is that usually going to be very messy. Here’s a primer on what that would look like with these accounts.
Scenario: You determine you want to invest 5% in REITs (real estate), 5% in cash, 20% in bonds, 45% in US Stocks and 25% in international stocks.
How do you divide these up between the above accounts? We have 5 types of investments to invest in and 9 different accounts to allocate them too. Our 401ks also offer different funds than brokerage/IRA accounts do. So what do we do?
Allocation Strategy
My strategy is to sort these from most tax-inefficient to most tax-efficient and start there. With that we get a list like this from most inefficient to most efficient:
- REITs
- Bonds
- International Stocks
- US Stocks
Then I sort the above accounts from most tax-advantaged to least tax advantaged. With that we get an order like this:
- My Roth IRA
- Mrs. Minafi’s Roth IRA
- Mrs. Minafi’s 401k
- My 401k
- Our brokerage
- My brokerage
- My checking
- Mrs. Minafi’s checking
- Our checking
Now it’s game of filling up each bucket (account) in sequence. You start with the 5% REITs and fill up My Roth IRA with them until you hit 5%. If you hit that, then you stop there. If you don’t hit 5%, you continue filling up the Mrs. Minafi’s Roth IRA account with REITs. Again, if you hit 5% you stop there. Let’s say there was enough space in My Roth IRA to put all 5%. After that, you move onto the 20% you want in bonds. This starts to get tricky, so bear with me. If you see that the amount of bonds you’ll need FAR exceeds the balances of a number of your accounts, what does that mean? It means that a bunch of accounts are all going to have the same investments. For bonds, that could mean that I fill up the rest of My Roth IRA with them, Mrs. Minafi’s Roth IRA, Mrs. Minafi’s 401k, My 401k and then STILL need to invest in some bonds within Our brokerage account and My brokerage account. Next, we move onto international stocks. That ends up going entirely into My Brokerage. US Stocks fill up the last of My Brokerage. For the cash part, can put that anywhere between checking accounts and our brokerage since they are all FDIC insured up to $250,000 each. The end result is an asset allocation something like this:
- My Roth IRA (REITs, Bonds)
- Mrs. Minafi’s Roth IRA (Bonds)
- Mrs. Minafi’s 401k (Bonds)
- My 401k (Bonds)
- Our brokerage (Bonds)
- My brokerage (Bonds, International, US Stocks)
- My checking (Cash)
- Mrs. Minafi’s checking (Cash)
- Our checking (Cash)
So many of these accounts are doing nothing more than investing in a bond fund, but if we did want 20% in bonds this would be how we’d do it (given the sizes of my accounts). If the bulk of your accounts are in 401ks, then this would be reversed, leaving you with US Stocks there (and potentially bonds/international as well).
Why This Isn’t Perfect
There’s one thing this doesn’t take into account – that each person may also need an allocation. In this scenario, Mrs. Minafi’s accounts are 100% bonds!
If something awful did happen, and we parted ways (obviously not something I ever hope happens) it’d be ideal if both of our investments were growing at a good pace in the meantime. For that reason we actually have US Stocks in Mrs. Minafi’s Roth/401k, then a higher amount of bonds in My brokerage.
Whew OK, that’s why we hold various investments in the accounts we do, back to our quarterly scheduled programming.
Specific Investments
There isn’t much to point out about the above investment list. As I mentioned, I’d love to have fewer funds overall, but the number of funds is driven by which buckets (accounts) I have to fill.
Vanguard Small-Cap Index: I only invested in this because I was bored with the Vanguard Total Stock Market and wanted more “control” over what I was invested in. If I were to sell it now I’d need to pay a bunch of taxes. If I had to do it again I’d just invest in Vanguard Total Stock Market and call it day.
Wealthfront and Betterment: These are only opened as an experiment to write about them. I was initially planning to sell these at the end of the year, but now I think I’ll keep them around to continue writing about them. A lot of people use robot-advisors, and I don’t see that changing. If I want to be able to talk with people about these, I should know more about them – even if I’m not relying on them for the bulk of my own investments.
Multiple Bond Funds: I’m in 3 different bond funds, but really only need to be in 1. The problem is that these are in different accounts – my 401k, my Roth IRA and a brokerage account. That means I need at least 3 different ones right there (the brokerage one could technically be the same, but I prefer the lower dividends version in my brokerage account for tax purposes).
Bitcoin/Ethereum: Uh oh, here we go. At their peak, these had a value of $158,845.27 before dropping to about $40,000 today. That’s rough. I’m very glad I limit my speculative investing to only 5% of my portfolio which prevents me from doing anything too rash. (by the way, the timing of that speculative investing post was still when Bitcoin was over $10k).
What to do with these? I’ll be honest, I have a bit of FOMO about Bitcoin, and this 5% (actually more like 2% of my net worth) helps to shoot for the stars. This $40k feels slightly like I’m investing in lottery tickets than in solid companies.
I do think AI/machine learning will be massive, and the platform of Etherum for running distributed code could change the world. It could be upstaged by another coin/platform who builds a better contract system just as easily too. Would I recommend you do the same? No, but if there is a specific company you truly believe will change the world, then invest in that one (but maybe cap it to 5%).
Asset Allocation Breakdown
One of the common mistakes that investors make is not diversifying their investments. I use a spreadsheet to compare my current asset allocation with my desired allocation. Each quarter I update my holdings with everything and check out how the combined allocation plays out. Here’s a look at things as of early September 2018.

Note: The value in this chart is slightly different than 9/1/2018 because this asset allocation wasn’t done on September 1st. I wait a week to do this in order to give room for all credit card transactions to finalize before running numbers for the previous month.
These only take into account my liquid investments – not my net worth – so there’s no company stock on this one. Most asset areas on this chart are well within the 5% tolerance I use to trigger any manual rebalancing.
Last quarter my US Stocks were off by 5.3% off and now they’re off by 11.2% from my target allocation (!). The main reason for this difference is because we sold $30k bonds (which were roughly even in price to what we paid) and moved that money over to cover a new car and some ongoing spending, while also refreshing our emergency fund.
This puts our portfolio wildly out of whack with our target allocation. I tend to hold more bonds than most pursuing early retirement. The reason for that is because it’s one of my goals to retire by age 40 (I’m 36 now). The closer you are to retirement then the more (to me) it makes sense to have money NOT in stocks.
There’s this thing called the “sequence of return risks” which plays into this. Here’s how that works: Assume you have $1,000,000 and want to see how long it’ll last if you spend $500,000 a year (high rolling!). Consider two scenarios:
Decrease then Increase
In the first year, the stock drops by half, in year two the stock doubles. For year 1, you lose $500k due to the drop, then take out $500k. Your ending balance is $0 and you don’t get any upside from the market doubling.
Increase then Decrease
In the first year, the stock doubles, then in year two the stock drops by half. For year 1, you gain $1 million due to the increase, and take out $500, leaving you with $1.5 million. In year two the market goes down by half, leaving you with $750,000.
The Risk
This example is for two years (and was similar to one given on the Afford Anything podcast which I’m currently binge-listening to) and for a much higher withdrawal rate (50%!) than anyone would ever want to use in an early retirement setting. It highlights just how big an impact the sequence of events plays in the value of your portfolio.
What if instead, both accounts had a partial bond allocation, leading them to only drop 25% on the loss years and only gain 75% on the good year? In that case, the worst case would have $250k and the best case would have $562k. For these very contributed scenarios, that’s a +250k/-188k difference. This is why it’s important for me to have a more conservative asset allocation right around the time I’d start drawing money from it.
Should I Invest More In Bonds?
So do we invest more in bonds and sell some of our US Stocks? I’d say if we had no other wildcards and we wanted to stay within this asset allocation that’d be exactly what we’d do. We do have this company stock wild elephant too, which complicates things. Add to that some ESPP money coming later this year which could be invested into bonds without the need to sell stocks (and pay additional taxes).
Before next quarter I plan to make changes to get these closer to my target alignment. I do still want to the smoother ride due to bonds in the years surrounding retirement, even if that means giving up some growth in the short term.
Spending & Savings
Here’s a look at all the categories broken down for the year. I use Personal Capital to track every expense, the value of every fund, income and a do a whole lot more. If you’re looking for one tool to do everything, I’d recommend checking it out (it’s free).
| Q1 | Q2 | Q3 | Monthly Avg | |
|---|---|---|---|---|
| Home | $6,093.24 | $6,942.24 | $6,677.71 | $2,190.43 |
| Transportation | $2,185.00 | $2,209.00 | $7,435.83 | $1,314.43 |
| Entertainment | $895.00 | $1,789.00 | $1,261.81 | $438.42 |
| Travel & Luxuries | $5,411.00 | $5,197.79 | $6,922.39 | $1,947.91 |
| Food | $2,706.00 | $3,114.00 | $2,774.17 | $954.91 |
| Education & Career | $231.00 | $275.00 | $845.49 | $150.17 |
| Personal Care | $1,088.00 | $2,134.44 | $2,168.75 | $599.02 |
| Pets | $1,220.00 | $654.00 | $1,096.03 | $330.00 |
| Other | $5.00 | $2,795.91 | $443.60 | $57.29 |
| Total | $17,194.73 | $25,112.05 | $29,625.78 | $8,285.79 |
A few of these expenses are on the large side this quarter.
Home – $6,677. Our largest single expense every month is our rent – which comes out to $2,068.01 a month. That includes water, parking, pet rent, cable/internet (we have no other wired options for these), sewer, trash, pest control and storage unit a few feet from our apartment. The base rate is $1,820, so it’s about $240 for all of the above. Add onto that about $50/month in power, $12/mo in renters insurance (which is still hilariously cheap to me after buying homeowners insurance) and this category is mostly those expenses.
We did spend some money this quarter finishing out our patio, including finding a really neat pot for it at a flea market. I’ve mentioned before that we’re loving apartment living. It still feels like a vacation. Having no yard work, painting or endless to-do list has made my weekends more enjoyable than I ever knew. When something is wrong, we file an issue in the apartment portal and they come to fix it. They know Lily (our dog) and we trust them to come in when we’re not here. On top of that, whenever there is a package delivery they sign for it! No need to worry about things being left for us.
Transportation – $7,435. This is unusually large this month because we bought a car! I subtracted out any amount from trading in our old car, meaning this is the entire out of pocket expense for us. This does mean that our 2018 number as a whole needs an asterisk by them as a “bought a car” year – something we hopefully only need to do every ~10-20 years. What’s nice is that our September spending on transportation was down to under $100! That doesn’t include pre-paid insurance for the year, but for basics like gas, parking and any other ride shares for the month.
Entertainment – $1,261. One positive change about the switch to Utah is better tracking for how much we spend on alcohol. Before, if be bought beer or wine it would be part of our grocery bill. Now, we need to head to a Utah state-run liquor store if we want to buy anything above 4% alcohol by volume. Of this amount, a full 60% is alcohol and bars. That also includes buying wine/beer for gatherings at our place or bringing something to others. We’ve made it a point to drink less in Q4, so we’ll see how that impacts this number going forward.
Travel – $3405. We spent a week of August in Scotland, visiting Inverness, Edinburgh and night in London. We absolutely loved the area, and want to go back to explore the western side of the island.
For the trip we spent 4 nights in Inverness, 3 nights in Edinburgh (during the Fringe festival) and one night in London. It was a quick but memorable trip! Here’s how the finances worked out:
$700 on tours and access to sites including Edinburgh castle and an all-day Outlander tour for Mrs. Minafi’s birthday where we visited a ton of great places including Castle Leoch, Culloden Battlefield and Clava Cairns (standing stones).
$156 on transportation, taxis, and busses during the trip.
$962 on lodging for the week. This includes 4 nights right in downtown Inverness, splitting an Airbnb with some friends in Edinburgh and a night a few blocks from Borough Market in London.
$800 on food. This comes out to $57/day per person which isn’t bad – especially considering that it includes alcohol as well.
I intend to a deep dive on the trip later, but here are a few highlights!

A photogenic Heilan Coo 
Mrs Minafi at Clava Cairns 
Ancient wall made by the Romans 
Adam for scale 
Culloden Field 
At Culloden Field 
Culloden House in Inverness 
Ancient tree at Castle Leoch 
Castle Leoch 
More Castle Leoch 
Urquhart Castle 
Photogenic bridge around Loch Ness 
An island in Loch Ness 
Highlands 
Loch Ness 
Haggis in Edinburgh 
High Tea in Edinburgh 
Climbing to Arthur’s Seat 
View of Edinburgh Castle from Arthur’s Seat 
Arthur’s Seat View 
Arthur’s Seat view 
Inside Edinburgh Castle 
Inside Edinburgh Castle 
Duck at Borough Market 
Oysters at Borough Market 
Mushrooms at Borough Market 
Camden Towner Brewery 
Theater in the Round


This travel line item doesn’t include FinCon which is instead listed down in the new Minafi category. 2018 has ended up being a crazy year for travel.
By the end of the year, it looks like we’ll have traveled to: Orlando (3x), Southeast Asia, Zion, Scotland, San Francisco, Virginia, Chicago (Mrs. Minafi only). I’m looking forward to more camping in 2019, which is now within driving range!
Luxuries – $3,405. This one had more expenses than I planned. We bought a new Nintendo Switch with a few games (partially with points from trading in games before the move), bought some new pants for our trip, new hiking shoes, a new purse and a new camera for Mrs. Minafi, a very large expense – a new iPhone XS! This is a lot for one quarter. I’ve been using an iPhone 6 for the past few years, and while it still worked it has been getting notably slower. I really like Mrs. Minafis collective noun for iPhones:
Food – $2,774, or $924/month. This is broken up into about $1,369 in groceries, $1,344 in restaurants and another $55 in coffee, dessert, and snacks. I think one reason this is lower is because we spent 2 weeks out of town. $360/mo for groceries and another $360/mo for restaurants isn’t going to break the bank, so we’re not too concerned here.
Education & Career – $895. This one is unusually high. It includes both our cell phones, T-Mobile for Mrs. Minafi and Mint Mobile for me paid yearly. The big expense was deciding to buy umbrella insurance for us. Writing about money on the internet is scary. Just writing this post could make me a target looking for someone with cash to sue. Umbrella insurance would cover those forms of attack and more, giving me more confidence to keep writing as transparently as I have been,
Personal Care – $2,168. This one seems like a lot because it is. It breaks down into about $600 on clothes (including my new favorite pants – a pair of Bluffworks Chinos), $400 in CrossFit and the rest as a combination of personal beauty supplies and haircuts. This is the first quarter that Mrs. Minafi and my expenses are fully joined, and this has been the most unexpected category. Apparently getting women’s hair dyed isn’t cheap! Completely understandable for sure.
Pets – $1,096. Another expensive quarter of dog ownership. Just before we left for Scotland our pup came down with something scary. She wouldn’t even get up off the couch and move. We ended up taking her to the vet 4 days in a row and leaving with some meds that would eventually help her, along with a new diet.
Minafi – $1,700. Blogging doesn’t need to be expensive, but it can be. FinCon itself isn’t cheap at $200+ for a ticket plus more for hotel and airfare. My total spending came out to $779 for the 4 nights there. I recently shelled out some money for a few really nice plugins which I’m in the process of integrating into a new theme for Minafi. It’ll still be very minimalist, but it’ll allow for a lot more flexibility and site organization. I’m not including revenue or expenses from Minafi in any of my net worth numbers or savings rates.
Q3 Spending Retrospective
Spending $29k a quarter puts me on pace to spend $116k a year. That’s just crazy high! Luckily most quarters won’t have international trips and new car purchases. Take out our new car purchase and the travel/luxuries category and spending is a much less crazy $16,000.
For tax and ACA purposes, it makes sense to keep taxable income below $64,000 (for ACA deductions) or $77,000 (for low capital gains taxes). Given our cost basis on investments, we’re solid in this rate – even if we spent $116k/year. I’d be much more comfortable if our total spending for the year was quite a bit less though – closer to $70k/year spending.
Savings Rate Over Time
This isn’t going to be good. I’ve been using savings rate as a lifestyle inflation canary for a while. Last quarter that canary is in some serious trouble. My existing SR graph is thrown so much out of whack by this spending that I needed to readjust my formula. Trailing 12 months SR is a better way of looking at this.

For Q3, our savings rates were 37%, 17% and 51% for the respective months. Not too bad considering the spending levels.
The 3-month, 6-month, and 12-month rates are based on the total amount spent and earned over those periods. This is entirely based on how much I earned through sustainable methods + the occasional small addition from selling something on eBay. There’s also no profit from this blog, so that’s not a factor in these numbers (well, not in a positive direction at least).
The 401k contributions as well as ESPP contributions are factored into both the numerator and the denominator in this formula. It comes down to “total invested” divided by “total earned”. The “total invested” one is a bit more complex than that though since I don’t always invest every cent in a given month. Instead, I base my savings rate on the total amount I could have invested.
The Road to Financial Independence
We’ve (somehow) spent $75,000 so far this year, which would put us on pace to spend $100,000 in 2018. This is significantly higher we’ll likely spend though.
Looking at our yearly budget, the actual amount we’re aiming to spend ib a year is what we’ve already spent so far 9 months in. Time will tell if that’s realistic or not.
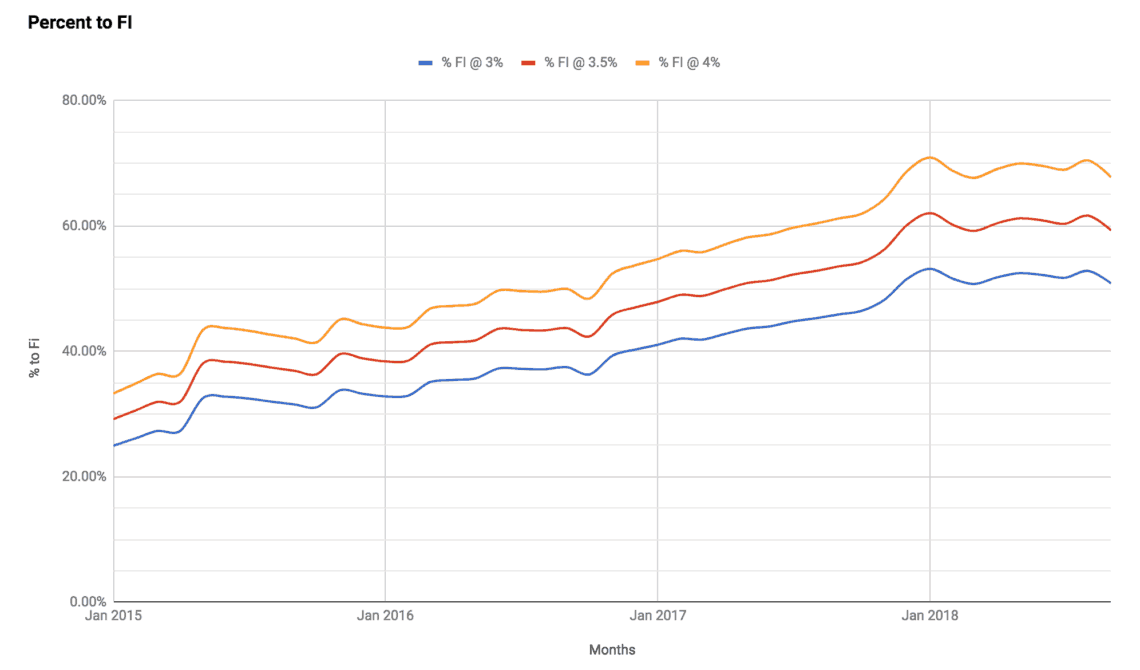
2018 has seen this chart stall somewhat. 2018 has had some ups and downs for investments. We’ll see what Q4 brings!
2018 Q3 Takeaways
When it comes to investments, there’s not anything I plan to change anytime soon. I’ve tried timing the market before and that’s a game I don’t wish to play. Instead I’ll continue to max out all investment accounts I can, fill up my ESPP, and hold for the long-term.
On the spending side, this should be the largest one in a while. Earlier this year we started investing the time needed to better understand travel hacking and have already booked two trips with points (FinCon and our upcoming Thanksgiving trip). I’d love to see that trend of free trips continue!
How did your investments do in the last 3 months of the year? Did you spend more or less than what you wanted?
Jim
October 15, 2018
What does the elephant thing mean?
Adam
October 17, 2018
Hey Jim, I mentioned it in the previous quarterly report that I linked to but looks like I should have clarified. It’s all company stock with certain restrictions.
Veronica
October 15, 2018
Hey Adam! I am interested in tracking better my expenses and my investments over time.
1) Is there a way to do this other than manually inputting everything into excel?
2)Any Advice here?
Adam
October 17, 2018
Hey Veronica! I’ve tried a bunch of services for this, and I prefer Personal Capital’s free tool for it. It’s what I grab the broad numbers from each quarter. It does some analysis and recommends changes if I’m not diversified enough too. To get more fine-grained you need to do it yourself though.
Bogie
October 15, 2018
Jim the elephant is that part Adam can’t talk about. I’m guessing is something like company options
Veronica – it’s hard to have an automated budgeting system. For example you go to Wal-Mart and buy food, clothing and windshield wiper fluid. The credit card only shows the total amount
I wrote a script which lets you use Google tasks to say something like “25 food, 50 car, 70 clothing” and automatically populates these categories in excel by month….and then each month by year. Email me
Adam
October 17, 2018
Yep! You called it. Company stock (not options).
That’s pretty neat! I’ll ping you about that Google task. I’m curious about how that works.
Sollod
October 17, 2018
I’m totally confused by your report. You should write more clearly.
You’re right about some random elephant with no explanation and then you have only a 1.2 million net worth.
These type of reports are useless to
Adam
October 17, 2018
Eek, this is good feedback Sollod. If you’re feeling that way others surely are too. I debated not including net worth and only doing straight investments which might be cleaner, since most of the investing advice in these reports is around that topic.
I mentioned a number of times that elephants are company stock – but it’s quite a long post, so I think it gets blurry as its mentioned a bunch.
I’ll see what I can do with the next one to make it more straightforward. Any other advice on ways to improve this that you would want to see?
Patricia
October 17, 2018
Nice pictures!
I notice in your breakdown you have some “our” accounts and then you have some “my” accounts, but Mrs. Minafi is lacking in an equivalent number of “my” accounts. I’m wondering why that is? I’d love a post on how and why the yours, mine, and ours breaks down.
Adam
October 17, 2018
Ohh, that would be a neat post. I’ll bat around an idea for that one.
The tl;dr is that I have a brokerage due to a high income/windfall situation which left that as the only other option. Mrs. Minafi has an IRA and I don’t because of a 401k rollover to it from a past job. Be a neat one to do a breakdown of the “why” behind each account though with thoughts on why others should/shouldn’t use that account type.
olivia
October 20, 2018
I love the pictures! They are all so pretty. Out of curiosity, is the dark blur at the bottom an editing effect or due to the camera?
Adam
October 21, 2018
Thanks! I think that’s a setting from the Gutenburg plugin when you use a gallery of images. If they have a title, it’ll show that with the little gradient. It can be disabled with a little CSS too.
Danielle Ogilve
November 6, 2018
Want to hear about more travel hacks to save money as you find them too!